Research Scientist · Computer Vision · Quantitative Imaging · Scientific Software
Kenneth W. Chapman, Ph.D., is a research scientist and computer-vision specialist whose work has centered on turning information visible in images into quantitative measurements useful for science and engineering. Across a career spanning industrial R&D, biomedical imaging, environmental measurement, human behavioral imaging, and scientific software development, his work has included image segmentation and feature extraction, temporal tracking, 2D and 3D measurement, machine learning, and the design of software systems that make those methods usable by others.
A recurring feature of this work has been interdisciplinary collaboration. In many projects, the scientific or clinical domain expertise belonged to collaborators; Chapman’s contribution was to determine what could be measured from imagery, develop the algorithms and software needed to measure it, characterize performance and error, and convert images or image sequences into reproducible quantitative data. The examples below represent a small selection of work that can be shown publicly; much of the commercial and biomedical work developed over the years was proprietary.
Selected Research & Software
Ocular Measurement and Pupil Tracking
Computer-vision software for detecting and tracking ocular features through time and converting binocular image sequences into quantitative measurements. This example illustrates a recurring theme in much of the work shown here: identifying measurable visual phenomena, tracking them robustly, and reducing image sequences to data suitable for scientific analysis.
3D OCT Retinal Image Analysis — Bioptigen
At Bioptigen, my work included computational analysis of three-dimensional Optical Coherence Tomography (OCT) retinal imagery. I developed algorithms for retinal-layer segmentation in 3D OCT volumes and methods for combining image information spatially and temporally for feature extraction. This work involved converting complex volumetric biomedical imagery into reproducible structural measurements that could support scientific and clinical interpretation.
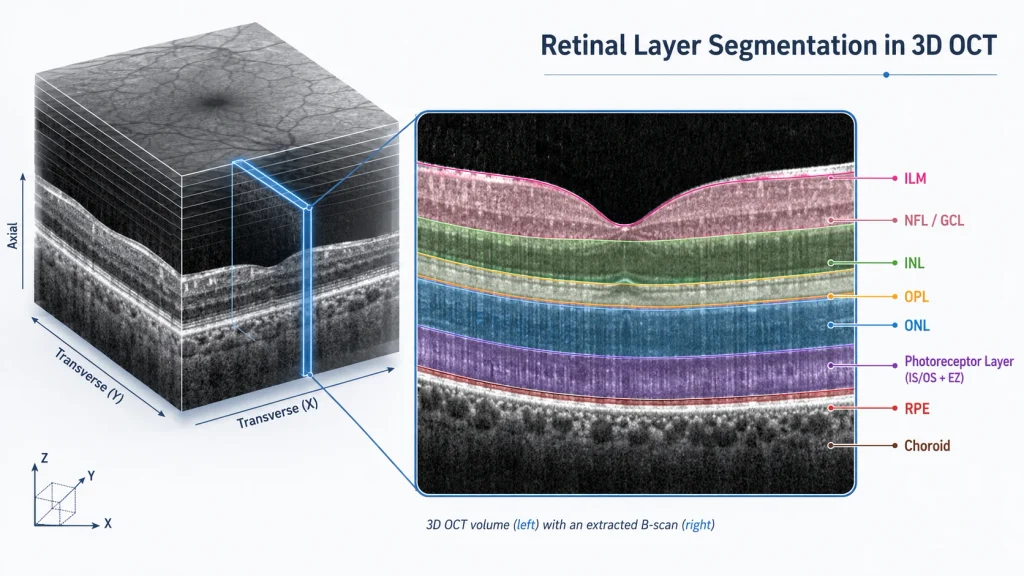
Illustrative rendering of retinal-layer segmentation in a 3D OCT volume, representative of the image-analysis problems addressed in my work at Bioptigen.
Computational Imaging from Brightfield Z-Stacks — Thrive Bioscience
At Thrive Bioscience, I developed computational imaging methods that begin with brightfield z-stacks. The individual images are registered and warped so that the world-coordinate XY position represented by each pixel remains aligned throughout the stack. From the aligned data, the system derives quantitative phase images (QPI), z-maps, extended-depth-of-focus (EDOF) images, and other image transforms that provide useful inputs for machine-learning and deterministic segmentation and analysis.
For QPI, the method uses a Waller high-order equation fit at each XY pixel position to inform calculation of the Transport of Intensity Equation (TIE). The implementation was engineered for very high computational performance: 5-megapixel image stacks can be processed in approximately 1–2 seconds on an ordinary desktop computer equipped with a mid-range NVIDIA gaming GPU.
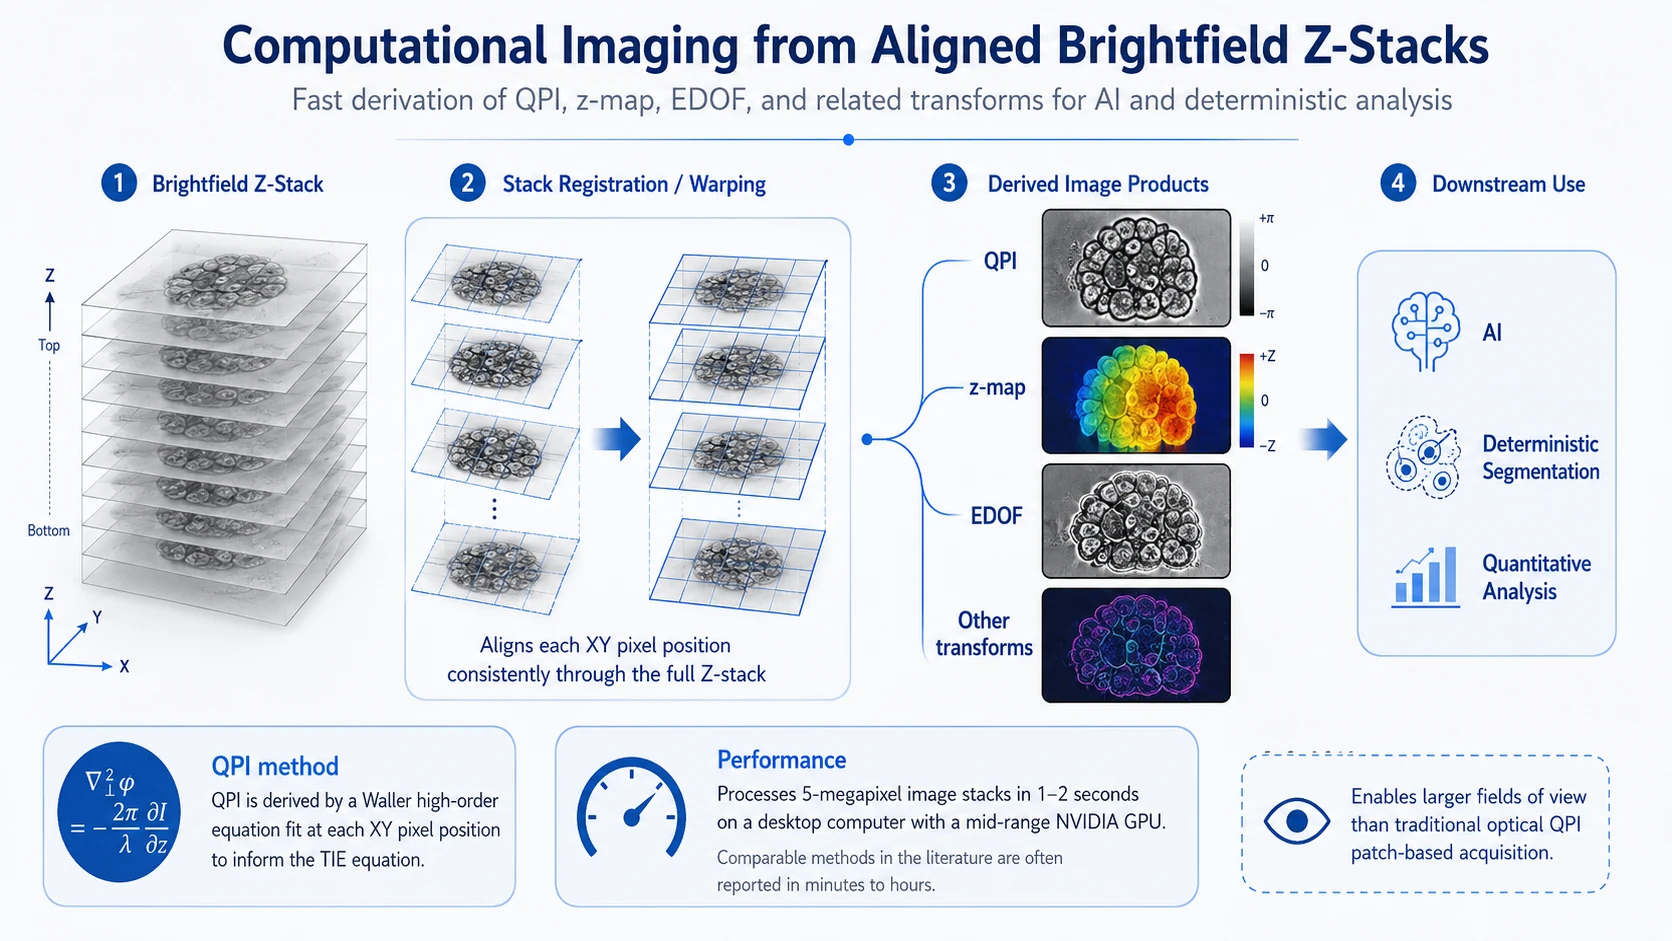
Computational imaging pipeline for deriving QPI, z-map, EDOF, and other quantitative transforms from registered brightfield z-stacks.
The short video below shows one example of a three-dimensional visualization derived from the QPI-based computational imaging pipeline.
Representative 3D visualization derived from QPI analysis of a brightfield z-stack. The rendering alternates among pseudo-colored QPI, an 8-bit grayscale representation of the quantitative phase image, and a brightfield grayscale surface applied to the reconstructed three-dimensional geometry.
GaugeCam / GRIME — Open-Source Scientific Measurement Software
GaugeCam began as a research effort to obtain quantitative water-level measurements from ordinary time-lapse imagery. The resulting GRIME2 software integrates camera calibration, geometric transformation, automated waterline detection, measurement, and visualization in a free, open-source scientific application. The work included development of the measurement methods, characterization of error sources, field validation, software engineering, documentation, publication, and long-term support. GRIME2 remains in active use, and development of its next-generation successor, GRIME3, is now underway.
The examples below show the calibration/measurement interface and automated waterline detection. Additional software, documentation, publications, tutorials, and demonstrations are available at GaugeCam.org.
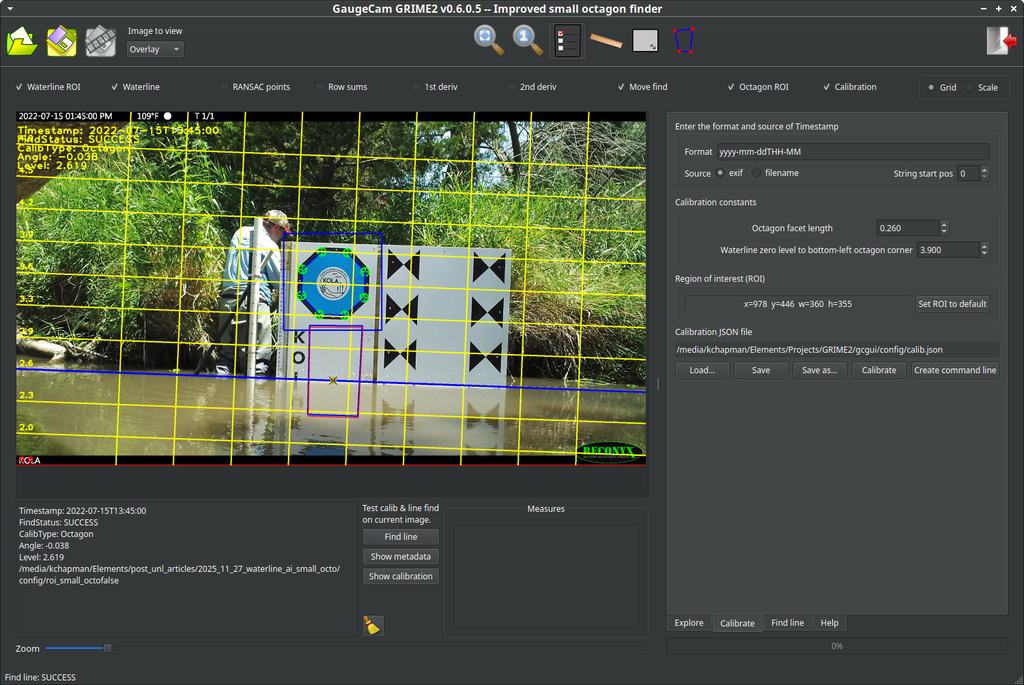
GRIME2 calibration and measurement interface showing the calibrated scene and measurement overlays.
Automated waterline detection operating across a time-lapse image sequence.
GaugeCam/GRIME illustrates the full progression from a scientific measurement problem through calibration, algorithm development, software implementation, field validation, publication, and long-term open-source support.
Measuring Change Through Time
Many measurement problems are not defined by what appears in a single image, but by how features change across an image sequence. Work in biological, environmental, and other time-domain applications has therefore included detecting motion, tracking evolving geometry, identifying temporal events, and reducing long image sequences to quantitative measurements and trends.
Cardiomyocyte Beating and Motion Detection in Cell Culture
Time-lapse image analysis can reveal dynamic behavior that is not apparent from any single frame. In this example, temporal changes in a cardiomyocyte cell culture are measured to detect contraction-associated beating and characterize motion through time.
Longitudinal Cell-Colony Segmentation and Quantitative Measurement
Image segmentation becomes substantially more useful when it supports measurement rather than simply identifying objects. In this example, colonies in longitudinal quantitative phase imagery are identified and measured across an image sequence, with the resulting measurements plotted through time. The combination of segmentation, temporal correspondence, and quantitative visualization converts a large image sequence into trends that can be analyzed scientifically.
Temporal Evidence Integration in Noisy Imagery
Individual frames in a noisy image sequence may provide insufficient evidence for reliable segmentation. In this example, Bayesian temporal estimation using Kalman filtering combines observations across time so that credible detections can persist despite weak or noisy measurements, while unsupported state information is allowed to decay. The result is substantially more stable segmentation than would be obtained by treating each frame independently.
Temporal integration of noisy detections using Bayesian state estimation, allowing supported detections to persist while unsupported evidence decays.
Measuring Evolving Geometry: Circular Scratch Closure
Some time-domain measurement problems are primarily geometric. In this example, the changing boundary of a circular scratch assay is detected across a time-lapse sequence so that closure can be measured quantitatively. The problem illustrates tracking an evolving shape through time rather than merely identifying whether an object is present.
From Image Features to Predictive Models
Quantitative imaging can also provide inputs to statistical and machine-learning models rather than serving as the final measurement itself. In doctoral research on the Platte River, characteristics of whitewater at a weir were detected from time-lapse imagery and reduced to scalar features. Those measurements were assembled into a structured feature table and used by machine-learning models to predict independently measured river stage and discharge.
The same general approach is used in current biological imaging work at Thrive Bioscience. AI-derived segmentation masks define cells, colonies, organoids, and other biological structures; two- and three-dimensional scalar features are then computed from the image information and transforms within those regions and followed through time. Those quantitative features can in turn support models for detecting and characterizing biological change.
Whitewater feature extraction at the Platte River weir, reducing image structure to scalar measurements for predictive modeling.
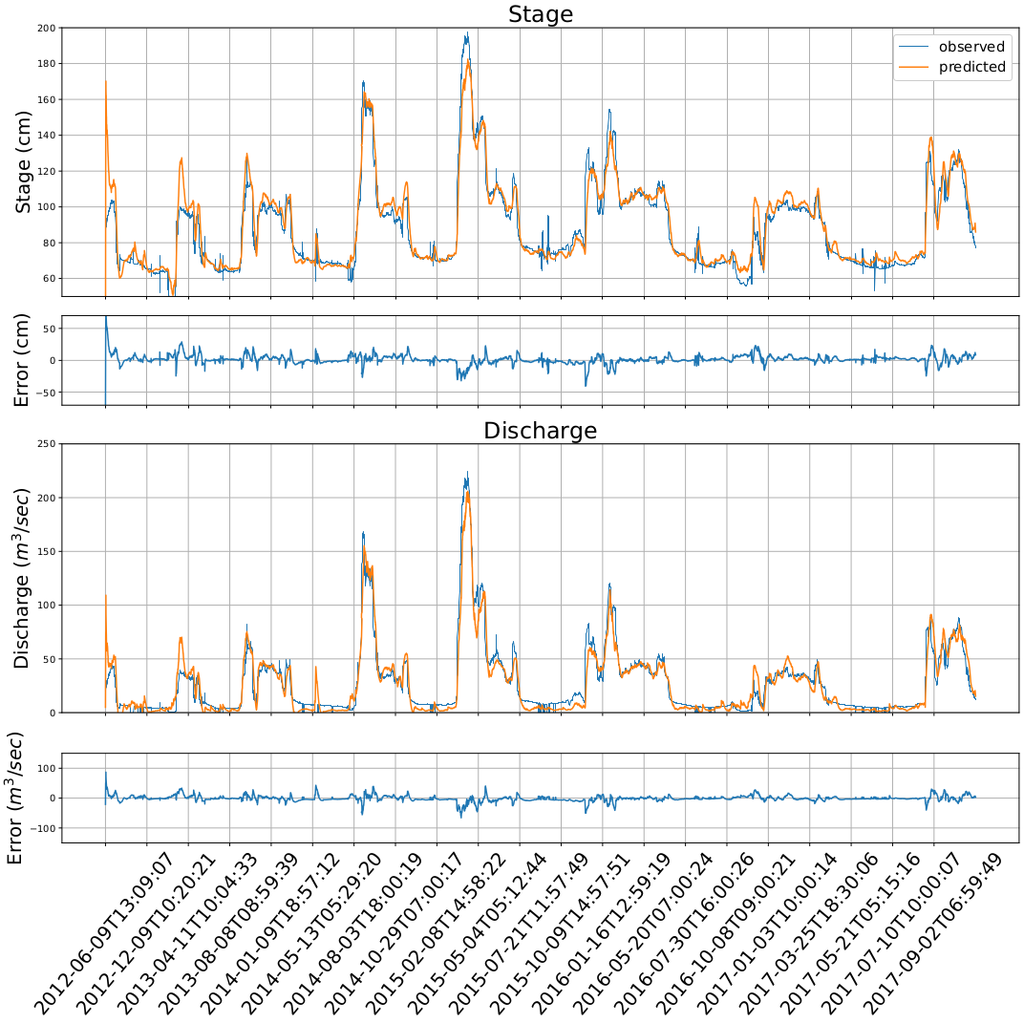
Observed and machine-learning-predicted stage and discharge, with prediction errors shown below each series.
This example illustrates a broader methodological pattern: imagery is converted into reproducible quantitative features, those features are organized into a structured table, and the resulting variables are used in predictive models of scientifically meaningful outcomes.
GRIME3 — Current Browser-Based Development
GRIME3 is the next-generation browser-based successor to GRIME2. This development snapshot shows current region-of-interest authoring, including interactive placement and refinement of measurement regions together with saving and restoration of the resulting configuration. Additional calibration, measurement, and automated analysis capabilities are under active development.
Current GRIME3 development snapshot showing browser-based ROI creation, refinement, saving, and restoration.